Creating Stunning Charts in Excel: A Step-by-Step Tutorial
Charts, often referred to as graphs, are invaluable tools within Microsoft Excel that allow you to present data in a visually appealing and understandable manner.
These graphical representations can take various forms, including bars, lines, pies, and slicers, enhancing your ability to communicate insights effectively.
Table of Contents:
1. Introduction to Excel Charts
In the realm of data analysis, charts are an indispensable tool that can transform complex datasets into digestible insights.
With the ability to choose from an array of chart types, such as columns, pies, lines, and more, you can visually represent information with precision and clarity.2. Types of Excel Charts
Elevate data analysis in Excel with a type of charts in Excel.
Discover a world of charting possibilities with options like column, pie, and more. Effortlessly transform data into insights using various chart types.
- 1. Column Charts: Ideal for comparing data across different categories, column charts display data as vertical bars, allowing easy comparison and analysis.
- 2. Pie Charts: When you want to showcase parts of a whole, pie charts come into play. They represent data as slices of a pie, making proportions visually evident.
- 3. Line Charts: Perfect for tracking trends over time, line charts use lines to connect data points, offering a clear view of growth or decline.
- 4. Bar Charts: Similar to column charts, bar charts present data in horizontal bars, enabling effective comparison of data points.
- 5. Scatter Charts: These charts help unveil relationships between two sets of data by plotting points on a graph, revealing potential correlations.
- 6. Area Charts: Depict cumulative values over time, showcasing trends and variations more prominently.
- 7. Bubble Charts: Adding another dimension to data representation, bubble charts incorporate the size of bubbles to convey an additional data point.
3. Creating Your Own Excel Chart
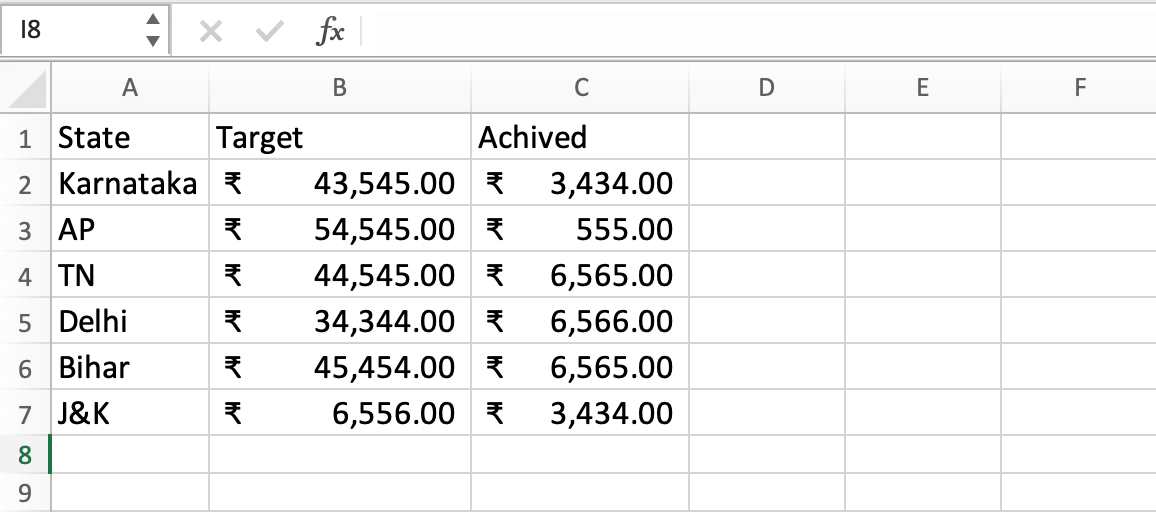
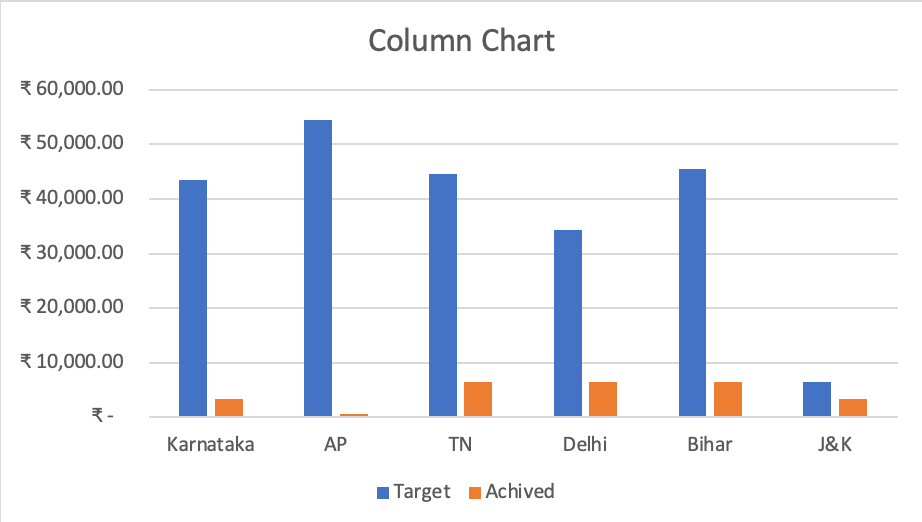
Experience the power of visual data representation with our illustrated charts. Witness how Karnataka, AP, TN, Delhi, Bihar, and J&K's achievements compare in an engaging column and pie chart.
Creating a column Chart in Excel
- 1. Select Your Data Range: Highlight the data you want to visualize, which serves as the basis for your chart.
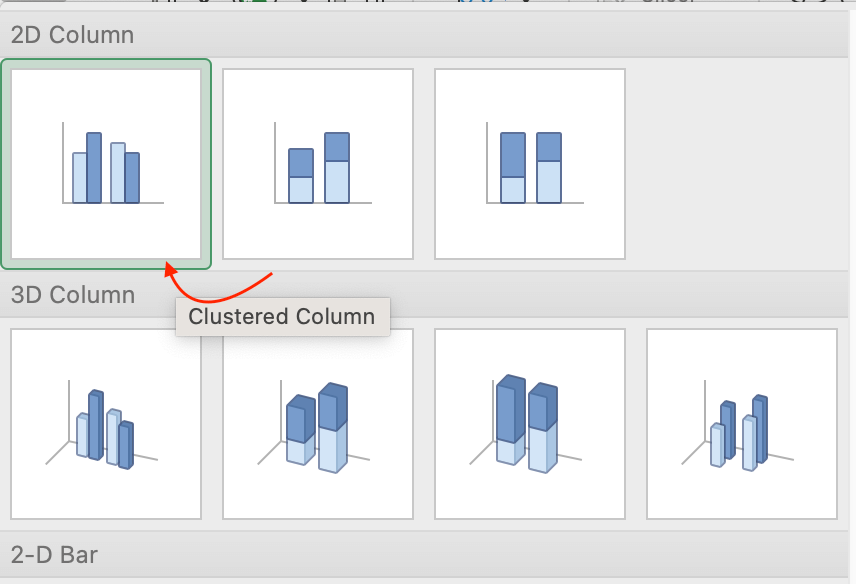
- 2. Navigate to Insert Tab and Chart Group: In Excel's ribbon, find the "Insert" tab, then click on the chart symbol that corresponds to your desired chart type.
- 3. Choose the Right Chart Type: Based on your data and the insights you intend to convey, select the chart type that best suits your purpose.
- 4. Crafting Your First Column Chart: Follow the steps to create a column chart, adjusting labels, titles, and formatting to enhance clarity.

Creating a Pie Chart in Excel: Achieved Proportion by State
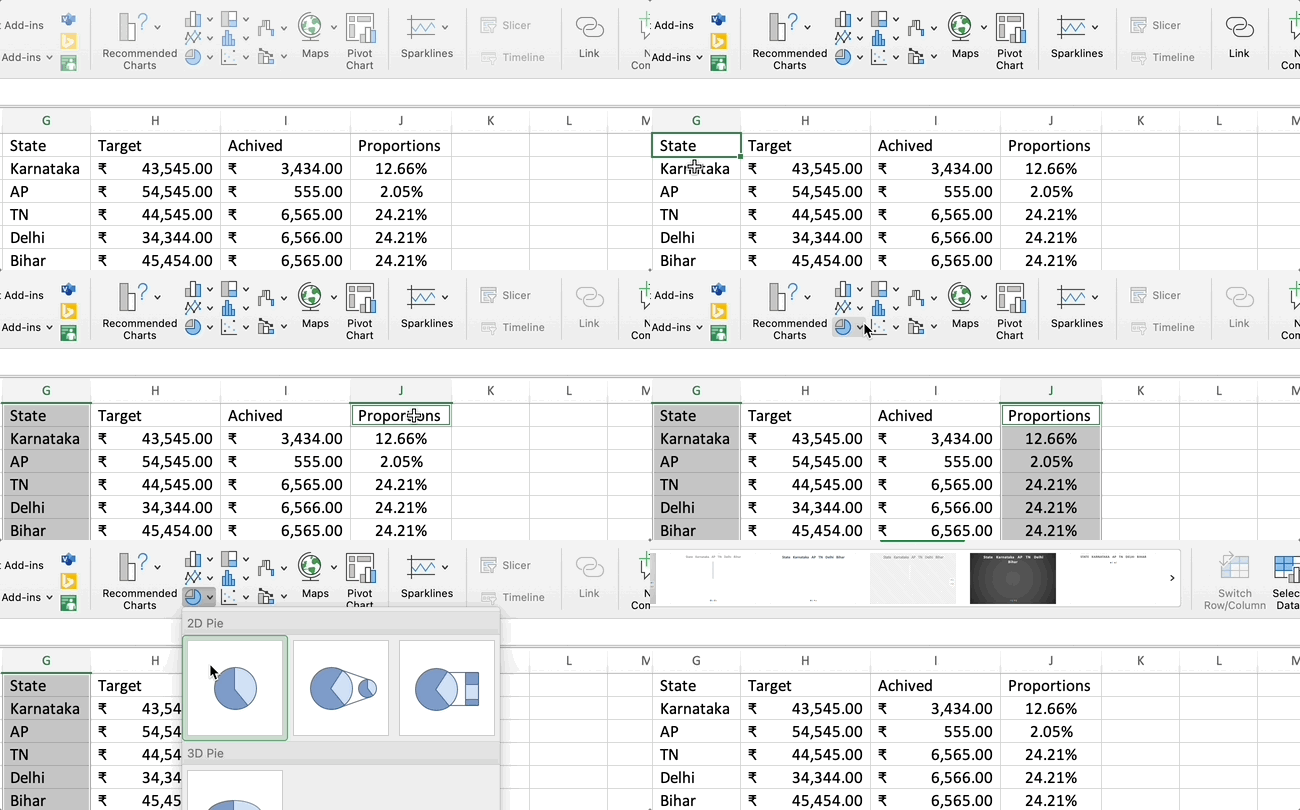
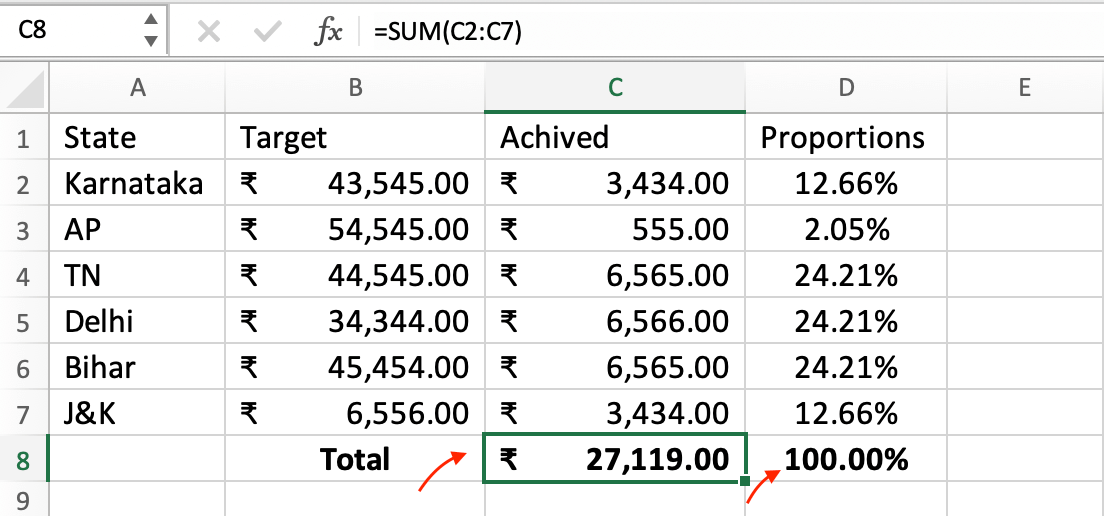
- 1. Enter Your Data: Enter the state names, target values, and achieved values in separate columns in an Excel worksheet.
- 2. Calculate Achieved Proportions: In a new column (e.g., Column D), calculate the achieved proportions for each state by dividing the achieved value by the total achieved amount.
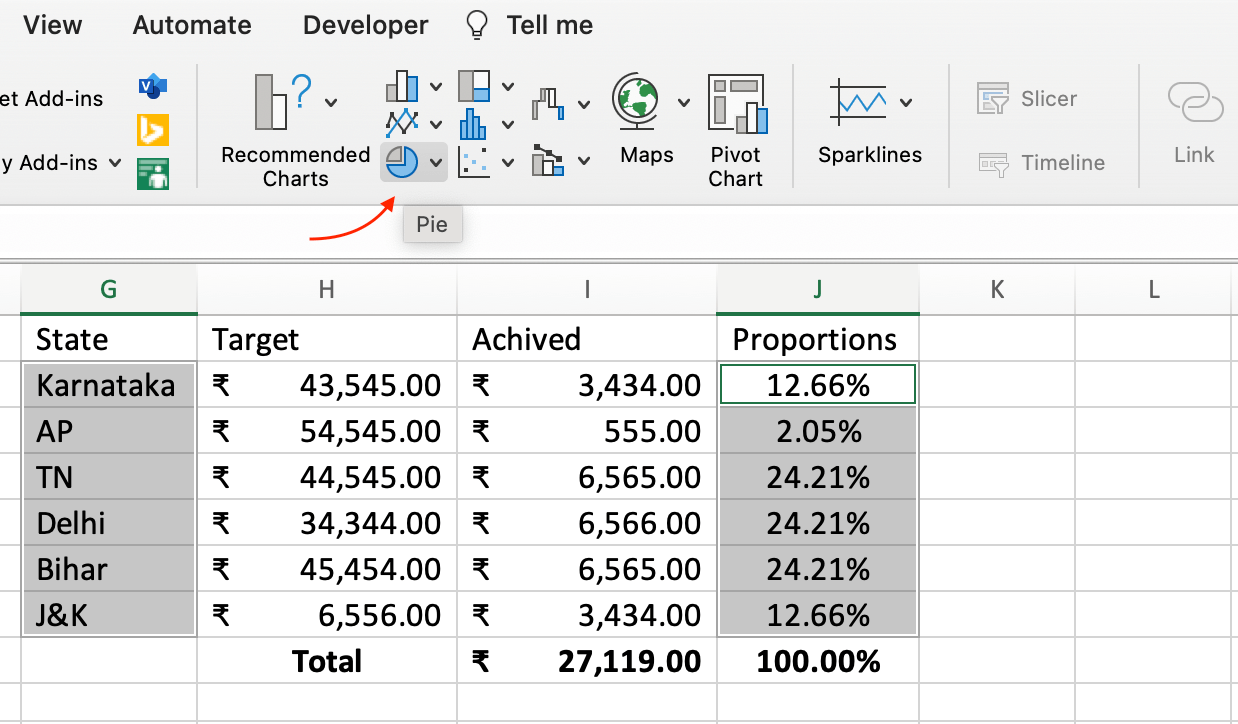
- 3. Select Data for the Pie Chart: Now, you have the achieved proportions calculated. Select the range including the state names (Column A) and the calculated achieved proportions (Column D).
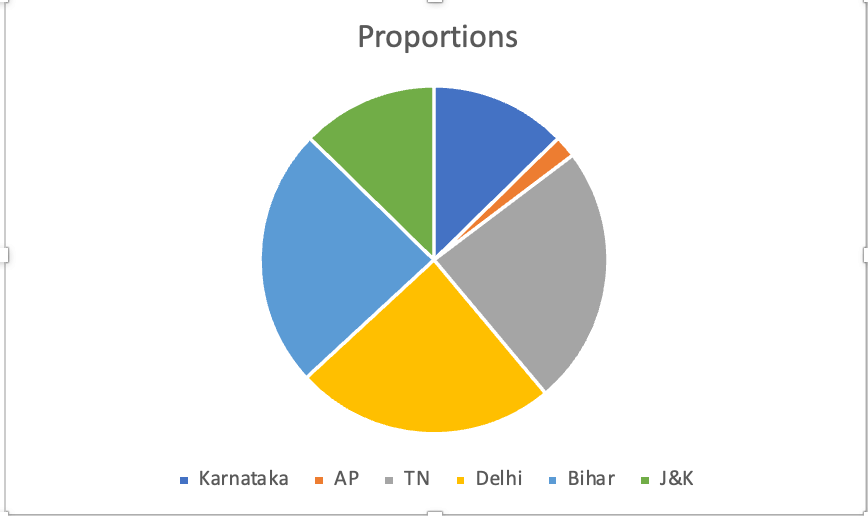
- 4. Insert a Pie Chart: With the data selected, go to the "Insert" tab in Excel's ribbon. In the "Charts" group, click on the "Pie Chart" dropdown arrow. Choose a basic pie chart style.
For this example, you can place the state names in Column A, target values in Column B, and achieved values in Column C.

You can calculate the total achieved amount using a formula like =SUM(C2:C7) in Cell C8 (below the column). Then, use the formula =C2/$C$8 (assuming the total achieved amount is in Cell C8) in D2. Drag this formula down for the rest of the states.
Customize the Pie Chart:
Once the chart is inserted, you can customize various elements for better presentation:
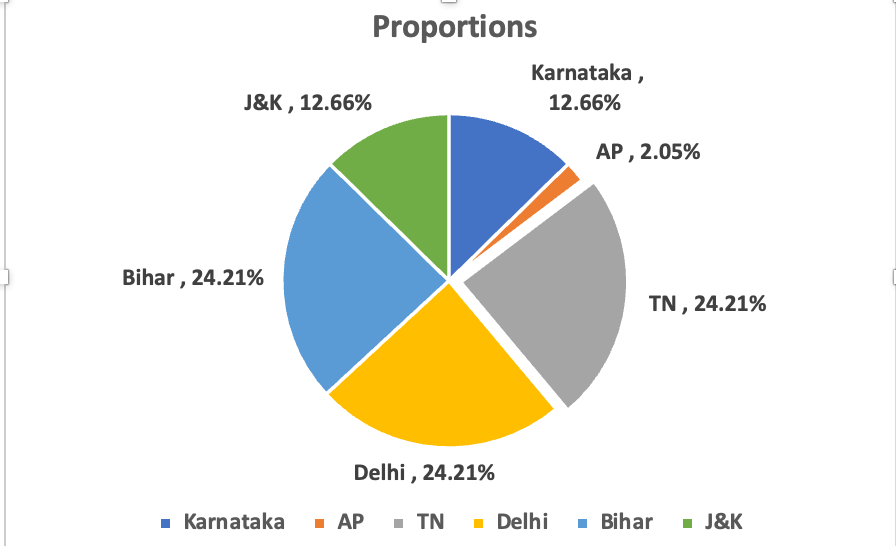
- 1. Add a title to the chart to explain what it represents.
- 2. Label the slices with percentages or actual values using the chart's "Data Labels" option.
- 3. Format the chart's colors, labels, and other design elements as desired.
- 4. You can also explode (pull out) a slice to emphasize a particular state by clicking on it and dragging it slightly.
Finalize the Chart:
Continue customizing the chart until you're satisfied with its appearance and clarity.
Note: The exact steps may vary slightly depending on your version of Excel. If you're using a newer version, you might also have the "Recommended Charts" option, which can suggest appropriate chart types based on your data.
Remember, pie charts are most effective when you're comparing parts of a whole. In your case, they show the achieved values of each state as a proportion of the total achieved amount. Make sure to label your chart and its slices clearly for easy comprehension.
4. Adapting Chart Types
- 1. Seamlessly Changing Chart Types: Even after creating a chart, you can effortlessly switch to a different type without losing your data.
- 2. Steps to Transform Your Chart: Access the "Chart Design" tab, click "Change Chart Type," and explore alternative chart options.
- 3. Exploring Various Chart Type Possibilities: From line charts to pie charts, experiment with different types to find the one that best highlights your data's insights.
5. Uses of Excel Charts
- 1. Enhancing Data Comprehension: Charts simplify complex data sets, making trends, comparisons, and proportions instantly understandable.
- 2. Diverse Array of Chart Types: Excel's rich variety of charts ensures there's a suitable option for every type of data representation.
- 3. Simplified Chart Creation for Beginners: Even if you're new to Excel, creating charts is user-friendly and requires no additional cost.
- 4. Streamlined Analysis of Live Data: Excel charts facilitate real-time analysis and modification of live data for swift decision-making.
6. Conclusion
In conclusion, Excel charts are dynamic tools that unlock insights hidden within data, catering to both beginners and seasoned analysts.
By embracing the diversity of chart types and mastering the art of creation, you can seamlessly convey information, fostering better understanding and informed decision-making.
