Group in Excel-Group and Un-Group In Excel
Group and Un-Group is a very useful schema in Excel. In our Excel Tutorial, we are already discussed a lot of formulas and functions.
Using Group and Un-Group in Excel we can group and un-group selected rows or columns according to our requirement.
This Group and Un-Group options available in Outline Group in Excel Ribbon. Outlining the excel data makes your data easier to view.
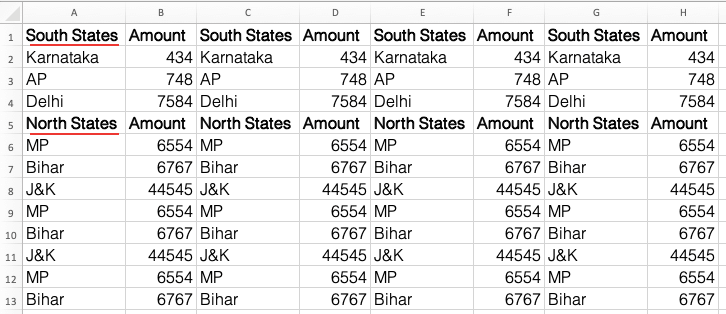
With the help of the below example, it is easy to understand the Group and Un-Group in Excel.

In this above example, if we want to see only South States data or the North States data we can use Group in Excel.
How to do Group in Excel?
1. First Select the Rows or Columns you want to group.
2. Go to Data Tab, click on the Outline group, and click on the group.

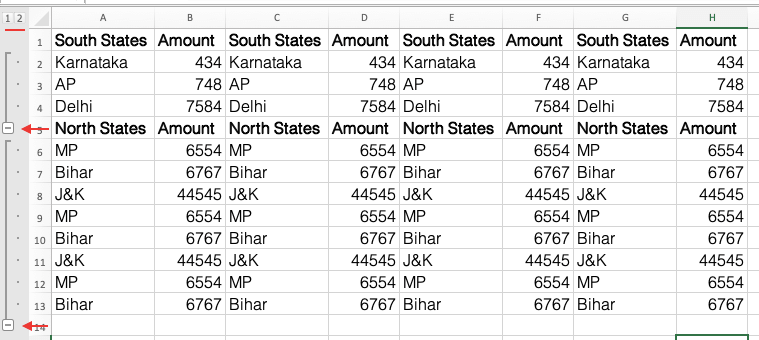
3. In this example, I have selected rows for grouping.
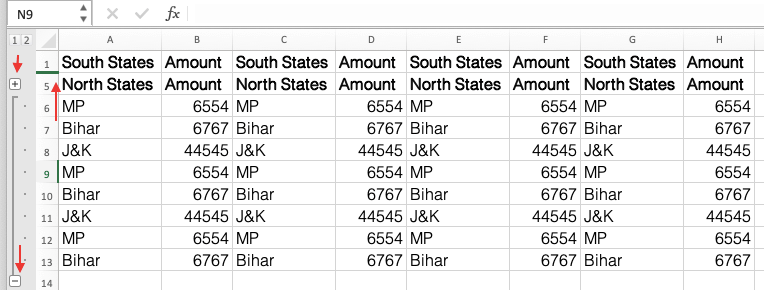
4. you will get a minus icon left side of the data. to hide selected rows group click minus sign. to get back hidden rows group click on Plus sign.

5. If you want to group columns instead of rows, just select columns instead of rows while grouping.
How to do Un-Group in Excel?
It is easy to do Ungroup Rows or Columns in Excel.
1. Select the sheet or range that you want to Ungroup in Excel.
2. Go to Data Tab, click on the Outline group, and click on the Un-Group.

3. That's it! all created groups will be cleared from that sheet.
